TGS Regional Ready-to-Use, High-Resolution Numerical Weather Prediction Model
TGS, in collaboration with Vaisala, a global leader in weather, environmental, and industrial measurements, has developed a unique regional wind energy dataset - the most extensive model currently available offshore East Coast US. Data covers the region of strategic focus for US offshore wind, between North Carolina and Massachusetts, including the New York Bight lease sale area currently under assessment. This comprehensive numerical weather prediction (NWP) model is designed to reconstruct meteorological conditions from the last 10 years at a spatial resolution of 1km with an hourly temporal resolution, providing operators interested in the New York Bight offshore wind lease sale with a unique, immediately available data resource that can evaluate wind conditions over each block and on a regional basis.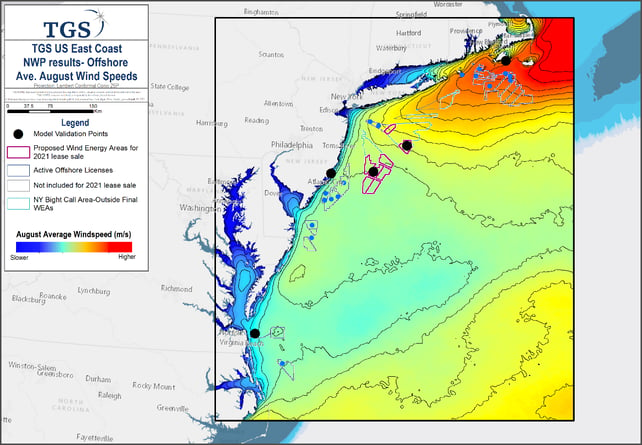
Average August wind speeds across the TGS' East Coast Wind Energy dataset, including the New York Bight lease sale area
Accurate - Dynamic - Trusted
TGS has teamed up with Vaisala to create a model which possesses a higher resolution and much wider scope than publically available data. This resolution is maintained across the entire dataset enabling clients to enhance both their regional models and their understanding of specific New York Bight lease areas.
In addition to being created by industry-approved wind modeling algorithms, crucially this model has been validated by public data to increase the confidence and further improve data quality in comparison with other datasets.
Energy Insights Expertise
TGS has been supplying the energy industry with insights to enhance operations for over 40 years. We have long-standing, well-respected experience in curating huge amounts of energy data and extracting key intelligence. Product development partnerships such as that formed with wind modeling experts Vaisalla, allow TGS to apply their data expertise to a wider range of energy sectors and introduce new products and technologies to enhance data-driven insight within that sector.
High-Resolution Numerical Weather Simulations
The TGS NWP model has utilized Vaisala’s Wind Energy Weather Modeling Technology. This model produced the lowest combined mean absolute error in a benchmarking test of 20 modeling techniques by the American Wind Energy Association (AWEA) and also outperformed rivals through specific 'stress testing' in challenging conditions.
The Vaisala method relies on a combination of advanced mesoscale numerical weather prediction (NWP) computer modeling, innovative and efficient microscale wind modeling, and proprietary algorithms to identify and combine the best information from the model output and client-provided wind measurements at the wind project site.
Actual weather events across the survey area are represented through mesoscale NWP models which include synoptic-scale weather systems (high and low pressure centers, fronts, upper and lower-level jets); thunderstorms and squall lines; monsoonal circulations; land-sea-breeze circulations; mountain-valley circulations; mountain waves; and topographic gap flows. In addition to topographical effects, these phenomena, when averaged over long time periods, can signify crucial spatial patterns or gradients of wind flow.
Unlike conventional methods that apply linear flow models, or Computational Fluid Dynamics (CFD) models, that derive their wind inputs from only a single point and therefore capture only the locally driven modifications to the wind field, this model is able to emulate regional meteorologically driven variations. This is achieved through mesoscale model simulation configured with an outer domain of many hundreds of kilometers around the area of interest, with nested domains of increasing resolution.
This approach allows the NWP model to fully represent atmospheric stability variations, through their use of the full Navier-Stokes equations and treatment of all relevant physical processes, including heating and cooling associated with the diurnal cycle, and turbulent mixing within the planetary boundary layer.
Mesoscale models predict stability, which has a strong influence on the wind profile in the lowest several hundred meters of the atmosphere, accounting for its effect not only on turbulent mixing but also its “buoyancy effect” on the vertical air motions in more organized circulation patterns. Typical CFD models do not reach this level of sophistication.
Product Specifications
| Spatial Resolution | 2km WRF with 1km TVM downscaling |
| Analysis Time Frame | 10-years: January 2011 to current |
| Temporal Resolution | Hourly |
| Hub Heights | 80m, 100m, 120m, 140m, 160m, 180m |
| Deliverables | Mean maps and gridded time series NetCDF files delivered via FTP in standard format. |
|
Maps:
NetCDF variables:
|
|
| Modeled domain area |
610.5 km x 692.8 km (422,926 km2) |